The purpose of this post is to show you how to access secrets from AKS cluster that are stored in Azure Key Vault.
In one of my previous blog posts, i have shown how to access keys from Key vault from Azure DevOps, where i have configured the release pipeline to fetch the secret from key vault and substitute it during runtime for the pipeline.
we have many other ways of accessing keys from key vault from any of the Azure resources we deploy, Using managed identities is one of the secure and easy ways to access to keep our app secure.
What are Managed Identities?
There are a lot of posts that are there which helps you understand what a managed identity is. If you go to Microsoft docs, here is the definition of managed identities you will get.
“Managed identities provide an identity for applications to use when connecting to resources that support Azure Active Directory (Azure AD) authentication. Applications may use the managed identity to obtain Azure AD tokens. For example, an application may use a managed identity to access resources like Azure Key Vault where developers can store credentials in a secure manner or to access storage accounts.” Definition credits: Microsoft docs
In simple words, any azure resource that supports azure ad authentication can have managed identities. Once we enable managed identity for an azure, a service principal will be created in active directory on behalf of that azure resource you create. With this, you can grant access to the an Azure resource that has managed identity enabled on the target azure resource you want to access.
For example, if you want to have a webapp access your key vault, all you need to do is to enable managed identity on your webapp and grant access to the managed identity of your webapp in the access policies of the key vault.
Without managed identities, in the above mentioned scenario you would need a service principal and a client secret to be created for your application (webapp in above scenario), and that service principal has to be granted permission on the target azure resource (key vault in above scenario). You need to configure your webapp to use the client id and secret to make calls to key vault to fetch the secrets.
You would have to manage the client id and secret by yourself. Incase if the service principal credentials are compromised, you need to change the secret every time and update the application code to consume the new secret. This is not only a bit insecure, but also tedious to update client secrets in multiple places.
Managed Identities to rescue
With managed identities you no longer have to create a service principal for your app, but when the feature is enabled on the azure resource, it will not only create an SP for you, but also it would manage rotation of keys by itself. You no longer need to keep client id and client secret of your service principal in your source code to access the target resource.
Kindly note that we are removing the burden of maintaining the service principal credentials in your code. But you still need to have appropriate libraries and respective code to access the target resource. For example, if your app is going to access key vault and if the app is going to be on a webapp with managed identity enabled, you no longer need to pass the service principal credentials to call the key vault api endpoint. You can call the key vault api endpoint directly from your webapp as it has managed identity enabled and that managed identity is granted permission on the key vault.
With that, Lets dive into some demo.
Here are the steps we are going to follow:
Create an AKS cluster
Enable managed identity to AKS cluster
Create a key vault with a secret in it.
Enable access to managed identity of AKS via access policies in key vault.
Access the secret in the key vault from a Pod in AKS.
We are going to create 2 resources in this demo.
AKS Cluster
Azure Key Vault
In this demo, i have created a sample AKS cluster using following commands after i have logged in to Azure from my azure cli
az group create --name yourresourcegroupname --location uksouth
az aks create -g yourresourcegroupname -n MyAKS --location uksouth --generate-ssh-keys
As we are discussing about managed identities and not about AKS, the above should suffice for creating an AKS cluster.
Once AKS cluster is created, you should see a new resource group created with name “MC_” this is for the underlying resource your AKS cluster needs to function.
Once its created, click on the VMSS that was created for your AKS cluster.
Once in the VMSS blade, click on the identity and notice that we have option for System Assigned managed identity.
Enable it by click on “on”.
Once its enabled, you should see a new managed identity resource created in the “MC_” resource group.
Next create and Azure key vault resource and secret in it.
az group create --name "yourresourcegroupname" -l "locationofyourresorucegroup"
I have created below key vault and a secret.
As of now, we have created an AKS cluster, enabled system assigned managed identity and created a Key Vault with a new secret in it.
Next, we are going to add permission to AKS to access key vault. To do so, go to access policies of Key vault and click on “Add access policy” option.
Select “secret management” in the configure from template option. Note that i have selected “secret management” for the sake of this POC. In real production environment, get, list permissions should be enough.
In the “Select principal” option, click on “none selected” to select one and choose “AKS Service principal” Object ID and “add”.
You should see the access policy added in the list of access policies and click ‘save’.
Once done, connect to AKS Cluster using below commands
az aks get-credentials --resource-group yourresourcegroupname --name youraksclustername --overwrite-existing
Once done, spin up an nginx pod using below commands.
use following command to login to the pod interactively
This way we can access the values in the key vault from AKS with managed identities enabled.
In this blog post, we have seen what managed identies are in a nut shell and seen how to enabled managed identity for AKS cluster and access the key vault from AKS cluster with help of access policy granted to managed identity of AKS cluster.
System Assigned managed identity lives as long as the resource is in Azure. Once the resource is deleted, the corresponding managed identity and its service principal are also deleted from Azure AD.
We also have whats called an User identity which exists even after a resource is deleted and you can assign it to one or more instances of an Azure service. In the case of user-assigned managed identities, the identity is managed separately from the resources that use it and you are responsible for cleaning it up after use.
The purpose of this post is to show you how we can use Azure Key Vault to secure secrets of a webapp and call them from Azure DevOps using Variable groups. This is one of the ways to handle secrets for your deployments. One of the other ways is to use Managed Identities which is more secure. I’ll cover that in a different blog post.
What are secrets and why is secret management important?
Secrets management is the process of securely and efficiently managing the safe usage of credentials by authorized application. In a way, secrets management can be seen as an enhanced version of password management. While the scope of managed credentials is larger, the goal is the same — to protect critical assets from unauthorized access.
For managing sensitive application configuration like DB connection strings, API Keys and other types of application related sensitive keys. It is recommended to use Azure Key Vault or any other secret management solution for storing secrets. Azure Key Vault is a cloud service for securely storing and accessing secrets like connection strings, account keys, or the passwords for PFX (private key files). Azure Key vault can be used for all commonly used services like Azure Webapp, Azure Kubernetes, Azure Virtual Machines and many other Azure Services.
Data like connection strings, API tokens, Client ID, Password are considered as sensitive information and handling them poorly may not only lead into security incidents but also my compromise your entire system.
Here are a couple of poorly handled secret management practices.
Maintaining secrets in source code repository in a settings or environment config file
Having same password/keys for all the environments
Secrets are shared across all the team members
Teams using service accounts to connect to the database or a server
Avoiding the above would be the first step for an effective secret management.
Using Azure KeyVault for App Services
Using Azure DevOps, All the sensitive data like Connection Strings, Secrets, API Keys, and any other data you categorize as sensitive. These values can be fetched directly from Azure Key Vault, instead of configuring them on pipeline.
Let’s take an example of configuring DB Connection string for an Azure WebApp using Azure KeyVault.
Lets create a KeyVault along with a secret in it. Notice that the key value is secret.
Similarly, lets create one more for UAT DB connection. Once created, it will show the keys created as in below screenshot.
Now in Azure DevOps, create a new variable group under the library section of pipelines.
Give variable group a name
Make sure to select the options “Allow access to all pipelines”, “Link secrets from Azure KeyVault”.
Choose KeyVault name and authorize.
Click on “Add” and select secrets for using them in the pipeline.
Below is the screenshot for reference.
Once done, in the pipeline, go to variables section click on ‘Variable groups’ and click on ‘Link variable group’ to choose the variable group that is created.
In the stages, select the environments and click link option.
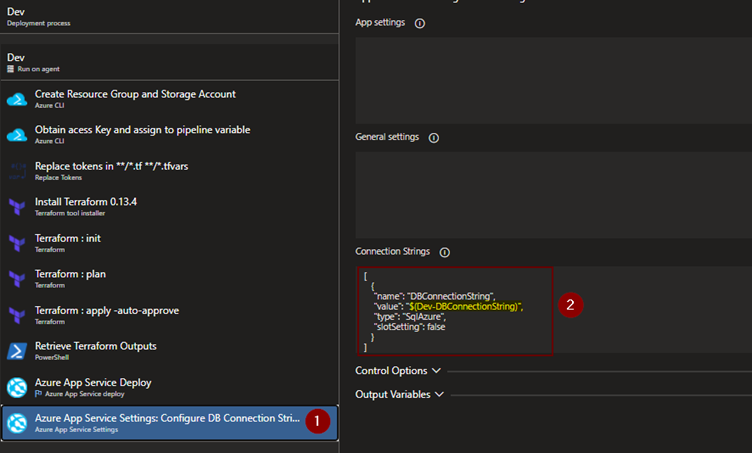
Now the next step is to configure the task for applying the DB connection string to the app service.
Add and configure “Azure App Service Settings” task and in the connection strings settings, configure the JSON value for applying DB Connection string. The value here is $(Dev-DBConnectionString) that is stored in Azure KeyVault. It is picked up by the pipeline during the execution.
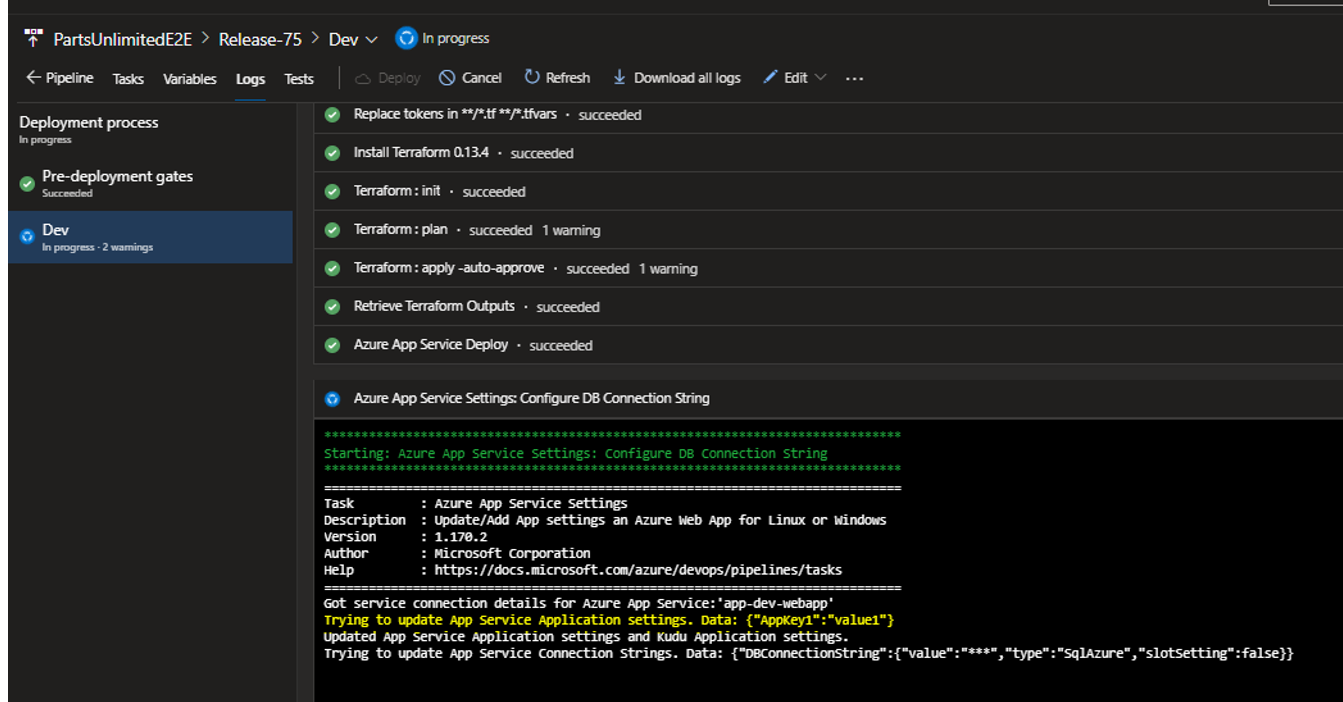
Below are the logs of the execution for the pipeline. Here it shows that the pipeline is able to fetch the value and it being a sensitive parameter, value of DB connection string is hidden in the logs.
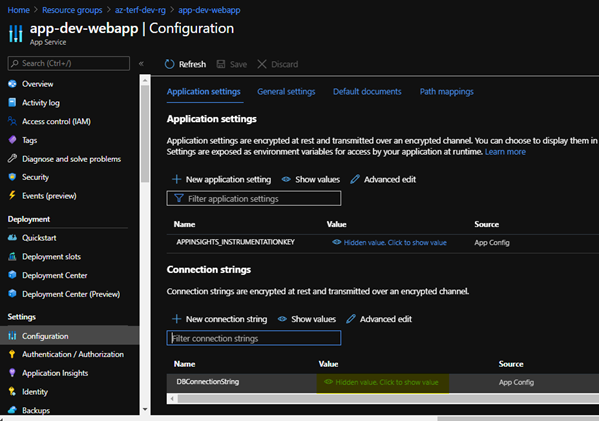
In the webapp, under configuration->Database connection strings, we will be able to see the actual value.
Once we click on the ‘show values’ we can see the value of connection string.
For configuring the other application settings which are NON-SENSITIVE, we can use ‘App Settings’ Section of “Azure App Service Settings” task to configure application settings, similar to DB Connection strings, we can use the values from key vault as well.
During the execution, we can see that application key that is configured in the above setting.
The other way to manage secrets without key vault is to use variable and the padlock option to lock the key value as shown in the below screenshots.
This way the secret is not visible to anyone, but if you would like to know the value, you need to other ways to handle it, the suggested approach is to implement a solution like Azure Key Vault with right access polices.
This brings us to the end of this blog post and we have seen how to use Azure Key Vault for Azure Web Apps with Azure DevOps and various options available to handle secrets in Azure DevOps using Variable groups and Variables.
The purpose of this blog post is to give you high level overview on what DevSecOps is and some steps on how security can be integrated in your Azure DevOps pipeline with help of some readily available tasks in Azure DevOps related to some commonly used security scanning tools in build and release pipelines.
Continuous Integration, Deployment and Delivery
If you are reading this article, I’m assuming that you must have encountered these terms – CI and CD by and you do have a fair understanding of them.
Let’s recap on what we mean by each of these terms.
Continuous integration
Continuous integration is a process of automating the build and testing the quality of the code when someone in the team commits the code to your source control. This ensures that a particular set of unit tests are run, build compiles successfully, without any issues. In case, if the build fails, the person committing the code should be notified to fix the issues encountered. This is one of the software engineering practices where the feedback on the newly developed code is provided to the developers immediately, with different types of tests.
Continuous Delivery Vs Deployment
Both Continuous Delivery and Deployment are interesting terms. In Continuous Delivery, once the CI is done and the code is integrated in your source code, the ability to deploy the code automatically to various stages of the pipeline seamlessly and making sure that the code is production ready is Continuous Delivery, However in continuous delivery, the code is not deployed to production automatically. A manual intervention is required.
Where as in continuous deployment, Every build or change that is integrated passes all the quality checks, deployment gates and they get deployed from lower environments till Production automatically without any human intervention.
CI & CD helps you deliver the code faster, great!!!
but how about security?
DevSecOps is no longer a buzz word, or maybe it still is, but lot of organizations are shifting gears towards implementing the notion of including security in their Software Development lifecycle.
What is DevSecOps?
Security needs to shift from an afterthought to being evaluated at every step of the process. Securing applications is a continuous process that encompasses secure infrastructure, designing an architecture with layered security, continuous security validation, and monitoring for attacks.
In simple terms, the key focus around DevSecOps is that you need to make sure that the product you are developing is secure right from the time you start coding it and that the best practices of ensuring that security are met at every stage of your pipeline and an ongoing practice. In other words, security should be met as one of the key elements from the initial phase of development cycle, rather than looking at the security aspects at the end of the product sign-off/deployment. This is also called as ‘shift-left’ strategy of security. It’s more of injecting security in your pipeline at each stage.
How do can we achieve security at various stages of the pipeline?
There are multiple stages involved in getting your code deployed to your servers/cloud hosted solutions right from the developers coding it from the pipeline till deploying them.
Let’s now see few of them and how we can achieve integrating security around our pipelines using this.
Precommit–Hooks/IDE Plugins:
Precommit hooks/IDE Plugins are usually used to find and remediate issues quickly in the code even before a developer commits the code to the remote repository. Some of the common issues that can be found or eliminated are credentials exposed in code like SQL connection strings, AWS Secret keys, Azure storage account keys, API Keys, etc. When these are found in the early stage of the development cycle, it helps in preventing accidental damage. There are multiple tools/plugins which are available and can be integrated in a developer’s IDE. A developer still get around these and commit the code bypassing these Precommit hooks. These are just the first line of defense but not meant to be your full-fledged solution for identifying major security vulnerabilities. Some of the Precommit hooks tools include – Git-Secret, Talisman. Some of the IDE plugins include .NET Security Guard, 42Cruch, etc. You can find more about other tools here:
Using secret management for entire code base is one of the best practices. There could be a secret management tool that you can use like an Azure Key Vault, AWS secret manager, HashiCorp vault built into your pipeline already for accessing the secure credentials. The same secret management has to be used by your entire code base and not just the DevOps pipelines.
Software Composition Analysis:
As the name indicates, SCA is all about analyzing the software/code for determining the vulnerable open-source components, third party libraries that your code is dependent on. In majority of the cases of software development, very less portion of code is written and rest of it is imported/dependent on from external libraries.
SCA focuses on not only determining the vulnerable open source components, but also shows you if there are any outdated components are present in your repo & also highlights issues with opensource licensing. WhiteSource bolt is one of the light weight tools that does scanning of the code integrates with Azure DevOps and shares the vulnerabilities and fixes in a report.
SAST (Static analysis security testing):
While SCA is focused on determining issues related to open source/third party components used in our code, it doesn’t actually analyze the code that is written by us. This will be done by SAST. Some common issues that can be found are like SQL Injection, Cross-site scripting, insecure libraries, etc. Using these tools needs collaboration with security personnel as the initial reports generated by these reports can be quite intimidating and you may encounter certain false-positives. CheckMarx is one of the SAST tools.
DAST (Dynamic Analysis Security Testing):
Key differences between SAST and DAST is that while vulnerabilities can be determined in the third libraries in our code, it doesn’t actually scan the deployed site itself. There could be some more vulnerabilities which can’t be determined until the application is deployed into one of the lower environments like PreProd by providing target site URL. You can run DAST in a passive or aggressive mode. While passive test runs fairly quick, aggressive tests run for more time.
In general, a manual Pen test/DAST can take longer time. This will be done by a Pentester from security team. A manual test can’t be done every time you check-in the code or deploy the code as pen testing itself would take some amount of time.
I have worked on cloud migrations to Azure & AWS and we usually raise a request for DAST & Pentest test to security team at the last leg of migration lifecycle and get a sign-off from security team after all the identified vulnerabilities are fixed. Usually security team the takes a week or sometimes more than a week for them to complete the report, they run scripts, test data, try to break the application and what not to see if the application we migrated is secure enough. Once the vulnerability report is out, we look at the critical & high issues reported and start working on fixing them. Majority of the times, the deliverable timelines used to get extended based on the amount of work we had to do to remediate the issues raised. With DAST testing using ZAP Auto Scanner task in Azure DevOps, we can identify and fix the issues even before they become a bottle neck later.
And, security just doesn’t mean DAST/ Pentest or code quality alone. The infrastructure you deploy should also be secure. With your environment deployed on Azure, you have Azure Polices/Initiatives that help you govern and put rail guards around your infrastructure by auditing & enforcing the rules you specify. You could enforce polices to make sure that your infrastructure meets your desired state. For example, using Azure Polices, you can enforce use of managed azure disks only, storage accounts are not publicly accessible, Subnets in a particular VNet doesn’t allow Inbound Internet Traffic, SQL Server firewalls doesn’t allow internet traffic, etc. These are just of few of the tasks that you can achieve using Azure Polices. We will take a look at how Azure polices work in another blog post and also enabling effective monitoring and alerting is another key aspect.
Azure DevOps supports integration of multiple open source and licensed tools for scanning your application as a part of your CI & CD process.
In this blog post, we’ll see how to achieve security in our Azure DevOps pipeline using following tools:
WhiteSource Bolt extension for Scanning Vulnerability for SCA
Sonarcloud for code quality testing
OWASP ZAP Scanner for passive DAST testing
Sonarcloud for code quality testing:
1.WhiteSource Bolt:
Integrating WhiteSource bolt in your pipeline is pretty straight forward. In this blog post, I’m going to use one of the previous repos that I have used in my previous blog posts.
If you would like to follow along, feel free to clone/import it to your Azure DevOps repo and steps are in the previous blog post too.
To install WhiteSource Bolt in your Azure DevOps pipeline, search for “WhiteSource Bolt” from Marketplace and install it. You’ll go through a series of steps to get it installed in your organization.
It’s all straight forward.
I’m jumping straight ahead to the build pipelines, in which we are going to integrate WhiteSource Bolt.
Login to your Azure DevOps and click on Pipelines -> Build Pipelines and edit your build pipeline, you can import the complete project and pipelines from my git repo and the steps are mentioned my previous blog post. please refer to the link above.
Once in the build pipeline, to add the tasks click on “+” icon and search for “WhiteSource bolt” in Marketplace.
Back in your build pipeline, click “+” and add “WhiteSource Bolt” task
Leave the default settings as by default, it would scan your root directory.
Save and kick-off a new build.
In your build pipeline, you can see the logs of the task
In your build pipeline section, you will see that you have a new section for WhiteSource Bolt, you can click on this to view the results after the build pipeline completes the build.
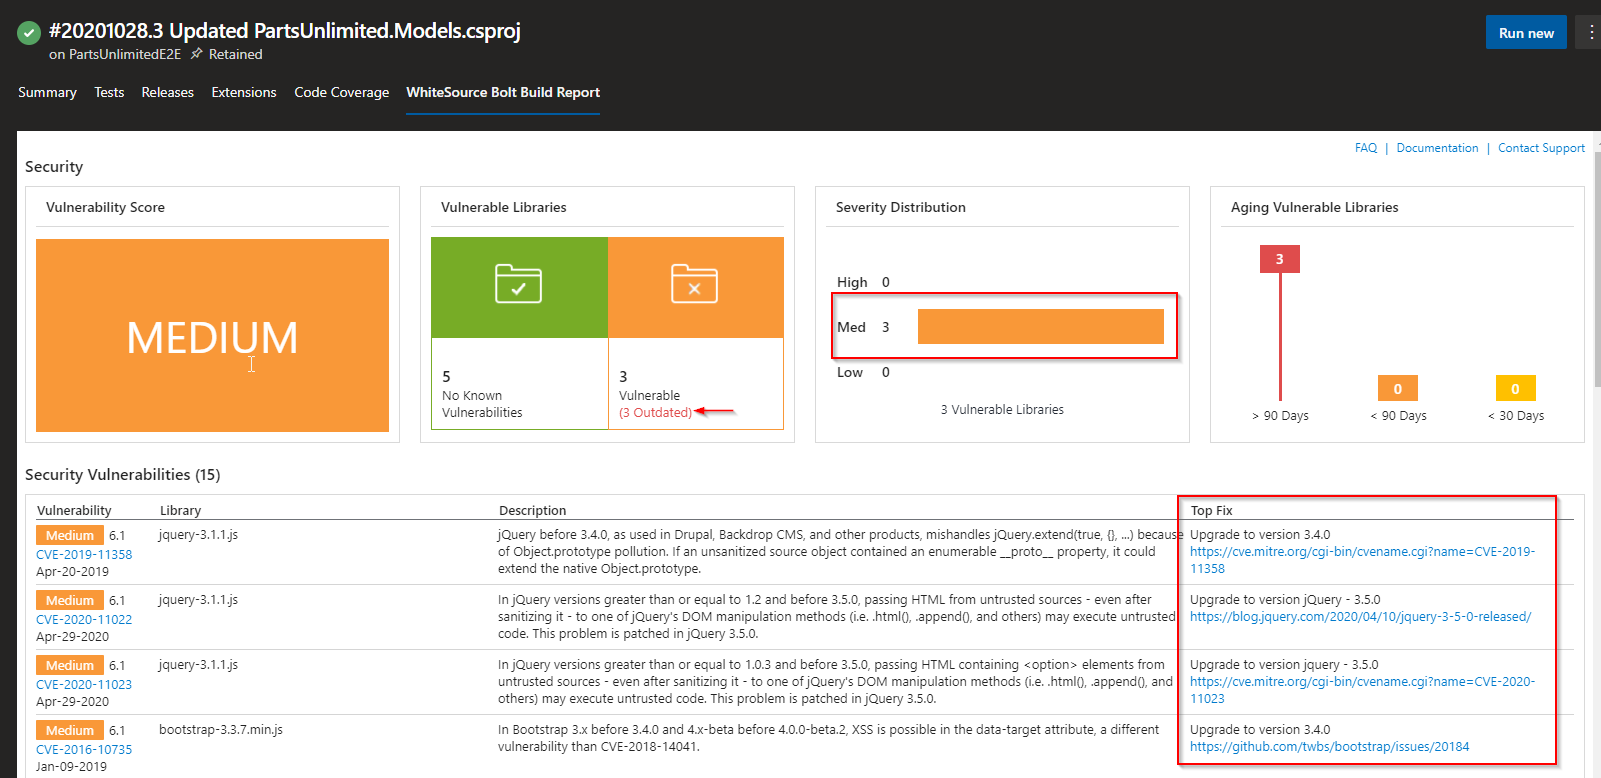
You can also see the results in the build pipeline results and the report tab.
Notice that it not only shows the vulnerabilities, but also shows the fixes for each of them. Note that this has only scanned the third party libraries and open source components in the code but not the deployed code on the target infrastructure.
This can be achieved via DAST testing in release pipeline using ZAP Auto Scanner. We’ll see that as well in this blog post.
2.Sonarcloud
Now, let us see how to integrate SonarCloud in Azure DevOps Pipeline. Prior to adding task in Azure DevOps, we need to import our Azure DevOps Project in SonarCloud.
You need Sonarcloud account for integrating it in the pipeline. Login to https://sonarcloud.io/ with your Azure DevOps account and choose your organization.
Select import projects from Azure.
Create a personal access token in Azure DevOps, copy the token and paste it somewhere, we need it later
Back in Sonarcloud site, provide the personal access token to import the projects, choose defaults to continue.
Generate a token in Sonarcloud that will be used in Azure DevOps. Once logged in SonarCloud, go to My Account > Security > Generate Tokens and copy the token and paste it somewhere, we need it later.
Select the application project Click on ‘Administration’ -> ‘Update Key’ to find the key for the project.
Now back in Azure DevOps we need to add SonarCloud tasks. Go to the build pipeline and install SonarCloud plugin from marketplace. Just like WhiteSource bolt, search for Sonarcloud and install it in our Azure DevOps Organization.
Unlike WhiteSource bolt, we need to add three tasks for analyzing the code with SonarCloud.
Note that the project I’m trying to analyze is .NET Core, but the process of including the steps doesn’t vary much for any of the other technologies.
Add the ‘Prepare analysis on SonarCloud’ task before Build task.
Provide following details for the task:
SonarCloud Service Endpoint: Create a new service endpoint by clicking on ‘new’ and copy paste the code generated, give a name for Service connection name, Save and verify
Select the organization
Add Project key generated from SonarCloud earlier.
Below screenshot shows how to add a new service connection after clicking on ‘new’ in step 1.
Add ‘Run code Analysis’ and ‘Publish Quality Gate Result’ tasks and save it and create a build.
Publish Quality Gate Result task is optional, but it can be added to publish the report link and quality gate result status to the pipeline.
Save and initiate a build. Once you run it, you should see the logs as below:
In the build summary, under extensions tab, you can see the link to view the results.
In the above screen, the quality gate status shows as none. the reason for that is, in Sonarcloud Initial status for quality gate shows as “Not computed” for the project we imported.
To fix it, under administration tab, choose “Previous Version” and notice that it says that ‘changes will take effect after the next analysis’.
Now, the status in overview shows that “Next scan will generate a Quality Gate”
Back in Azure DevOps, trigger another build and wait for it to complete.
Now under extensions tab of build summary, it should show the result status along with the link to view the Bugs, Vulnerabilities, etc. click on the “Detailed SonarCloud Report” to view the results.
The beauty of Sonarcloud is that you can integrate in your branch polices for any new Pull Requests raised and also as one of the deployment gates for deploying the bug free code to your environments.
3. ZAP Auto Scanner:
One tool to consider for penetration testing is OWASP ZAP. OWASP is a worldwide not-for-profit organization dedicated to helping improve the quality of software. ZAP is a free penetration testing tool for beginners to professionals. ZAP includes an API and a weekly docker container image that can be integrated into your deployment process.
Definition credits: owasp.org
With ZAP scanner you can either run a passive or active test. During a passive test, the target site is not manipulated to expose additional vulnerabilities. These usually run pretty fast and are a good candidate for CI process. When the an active san is done, it is used to simulate many techniques that hackers commonly use to attach websites.
In your release pipeline, click on add to add a new stage after PreProd stage.
Create a new stage with ‘Empty Job’.
Rename it to DAST Testing.
Click on add tasks and add get ‘ZAP Auto Scanner’ task from market place.
Once done, add following tasks one after the other.
OWASP Zap Scanner:
Leave Aggressive mode unchecked.
Failure threshold to 1500 or greater. This to make sure that the test doesn’t fail if your site has score more in number. Default is 50.
Root URL to begin crawling: Provide your URL that the scan needs to run against.
Word of Caution: Don’t provide any site URLs in the above step that you don’t own. crawling against sites that you don’t own is considered as hacking.
4.Port: default is 80, if your site is running on secure port, provide 443, else you can leave it to port 80
Nunit template task: this is mainly used to install a template that is used by Zap scanner to produce a report.
The in-line script used is present in description of the tool in Azure Market Place.
Generate nunit type file task: This used to publish the test results in XML format to owaspzap directory in the default working directory.
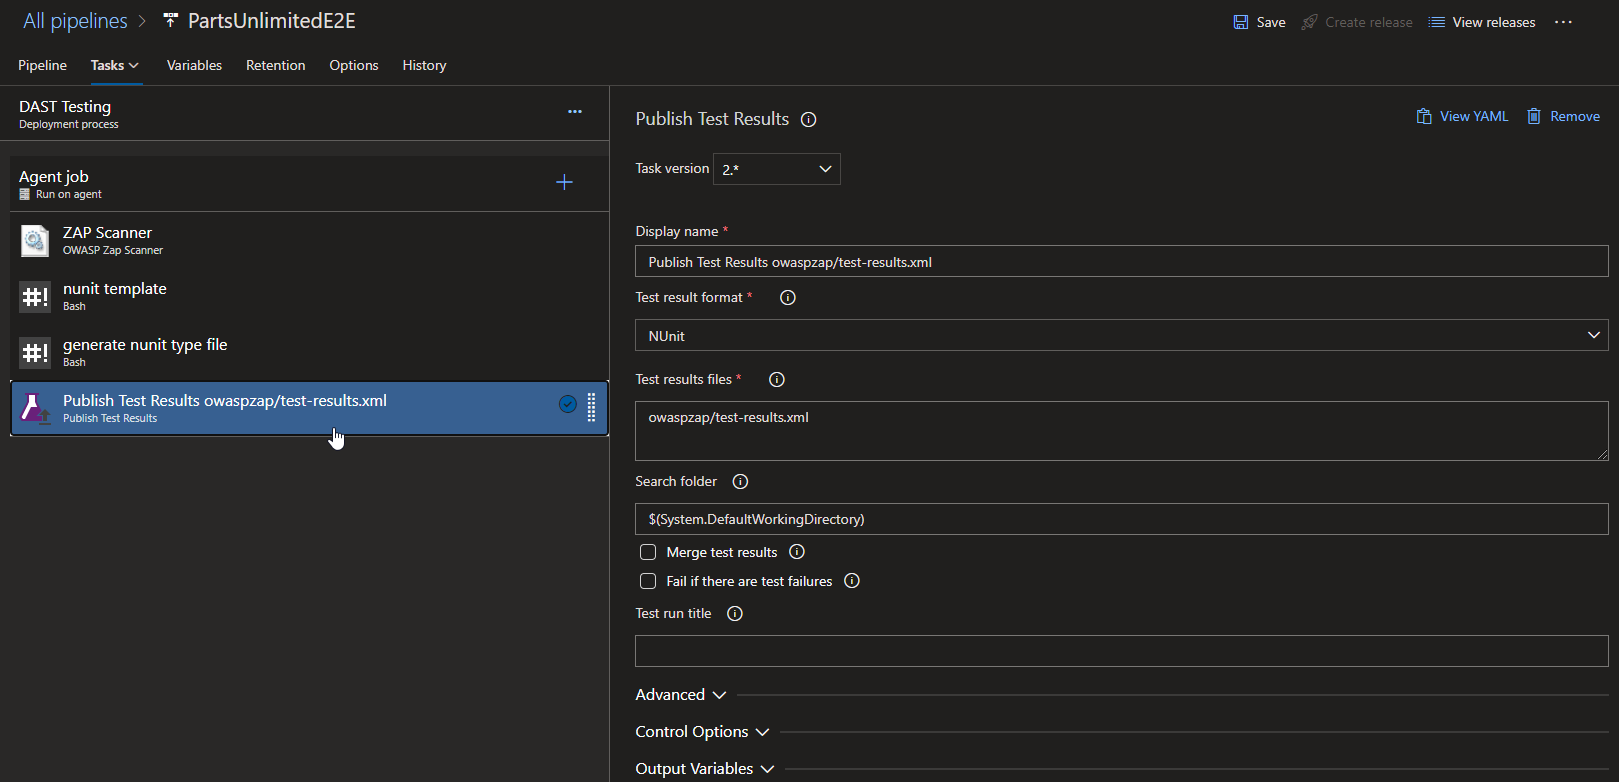
Publish Test Results task: this is mainly used to publish the test results from the previous task.
Make sure that you select the agent pool as ‘ubuntu-18.04’
Once everything is done, Kick off a release. Make sure that Preprod stage is deployed and the environment is ready before running DAST testing stage.
Once a release is complete, you should be able to see the results in the tests tab of the release you created.
With this, We have seen how to integrate security testing using WhiteSource Bolt, SonarCloud and OWASP ZAP Scanner in our DevOps pipeline at various stages of build and release.
This brings us to the end of this blog post.
Just like DevOps, DevSecOps also needs cultural shift. It needs collaboration from all departments of an organization to achieve security at each level.
Hope you enjoyed reading it. Happy Learning!!
Couple of references I used for writing this blog post:
The main purpose of this article is to show you how to deploy your infrastructure using Terraform on Azure DevOps and deploy a sample application on multiple environments.
I’ve been working on terraform for a while now and as a part of my learning process, thought I should write a blog post to show how to work with terraform on Azure DevOps and deploy an application into multiple environments.
In this post, we’ll spin up our infrastructure on Azure by setting up the build & release pipelines and We’ll also take a look at what each of the tasks in the build & release pipelines does.
Things you need to follow along
If you would like to do this on your own, following are the prerequisites you need:
Azure Subscription
Azure DevOps Account
Assumptions
This blog assumes that you have fair understanding of Azure, Azure DevOps & Terraform. Initially, we’ll go through the setup required and then I’ll discuss in detail about each of the pipeline steps.
Ok, lets dive right in.
As you may have already known, terraform is one of the infrastructure as code tools that enables us to deploy your landing zones in your respective cloud environments like Azure, AWS, GCP, soon.
Terraform is considered as one of the tools in DevOps toolset.
So, we’ll take a look at how we can deploy our landing zone to different environments using Azure DevOps and deploy a sample application to it.
I’ve taken a Microsoft’s demo application PartsUnlimted and added my terraform code to it.
It also contains the build and release pipeline json files you can import to follow along and replicate the same in your own subscription.
Here are the steps that we’ll do as a part of this our implementation:
Import the code from my github repo to Azure DevOps
Setup build pipeline
Setup release pipeline
Access the application in Dev
Deploy the application to PreProd, Prod
Walk-Through of terraform code, tasks in build & release pipelines
Once it’s done, it will show that the code is now imported and you will be able to see the repo with code.
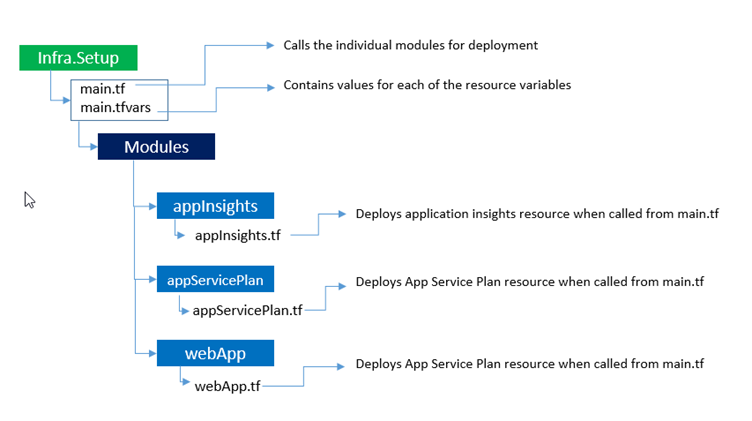
In the above folder,
Infra.Setup folder contains the terraform files that we will be using to deploy our infrastructure.
Pipeline.Setup folder contains the build &release pipelines json files. Download both the json files from Build Pipeline & Release Pipeline to your local folder
Repeat the same step to download release pipeline json file from the code ReleasePipeline->PartsUnlimitedE2E_Release.json as well to your local folder.
Build Pipeline Setup
Now, let’s setup the build pipeline. Click on pipelines -> pipelines
Click on ‘Import Pipeline’
Click on browse and select the downloaded build Json file.
Once import is successful, you will see below screen where it says some settings needs to attention
For the agent pool, Choose ’Azure Pipelines’
In the agent specification, choose ‘vs2017-win2016’
Click on ‘Save & queue’ to queue a new build.
Choose the defaults and click on ‘save and run’
Once its complete, you should be able to see the pipeline run and its results.
We can also see the published artifacts in the results.
Now this completes the build pipeline setup. Let’s also configure release pipeline.
Release Pipeline Configuration
Click on ‘releases’ and click on ‘New pipeline’
Quick Note: At the time of writing this article, we don’t have an option to import an existing pipeline from new release pipeline page when you don’t have any release pipelines. Hence we have to create a new empty pipeline to get to the screen where we can import the downloaded release pipeline json file.
Choose ‘empty job’ and click on ‘save’
Now, come back to the releases page and click on the releases one more time and choose import pipeline.
Choose release pipeline json that’s downloaded in the beginning.
It would look like below after the pipeline has been imported. Click on ‘Dev’ of the stage to configure the settings.
Quick note: You need to have following tasks installed from Azure Market Place. if you don’t have them in your subscription, please get them from here.
Click on ‘Azure cli’ & ‘App service deploy’ tasks and choose the subscription to authorize.
Quick Note: I’m not using service principals/connections here to keep it simple for the purpose of this blog post.
Repeat the same steps for rest of the stages ‘PreProd’ & ‘Prod’. Once you complete all the tasks that needs attention, click on save at the top of the screen to save the pipeline. Here is how the pipeline should look like after you complete everything.
After you have saved everything, click on ‘Create release’ in above screen.
Click on ‘logs’ option to view the logs for each of the tasks.
After successful deployment to Dev, it would look like this.
Once everything is done, you would see that code is deployed successfully to dev and you can browse the page by accessing the webapp link.
Go to your Azure portal and grab your webapp link and access it.
Back in your Azure DevOps release pipeline, As continuous deployment is enabled, it deploys the code to all the environments one after the other once the deployment is successful.
Now let’s take a minute to examine what each of the files in our Infra.Setup folder does.
I’ve used the concept of modules in terraform to isolate each of the components we are deploying. This is similar to linked templates in ARM templates.
Every terraform file that we author is considered as a module.
In a simple Terraform configuration with only one root module, we create a flat set of resources and use Terraform’ s expression syntax to describe the relationships between these resources:
In the above code block, we declare two resources, app service and service plan in a single file. Later, app service is referencing the app service plan in the same file. while this approach is fine for smaller deployments, when the infrastructure grows, it would be challenging to maintain these files.

When we introduce module blocks, our configuration becomes hierarchical rather than flat: each module contains its own set of resources, and possibly its own child modules, which can potentially create a deep, complex tree of resource configurations.

However, in most cases terraform strongly recommend keeping the module tree flat, with only one level of child modules, and use a technique similar to the above of using expressions to describe the relationships between the modules.
Here you can see that both app service plan and app service are called as modules by main.tf file
> Definition Credits: Terraform.io
#### Benefits of modular based templates
Modules or Linked Templates yields us following benefits:
1. You can reuse the individual components for other deployments.
2. For small to medium solutions, a single template is easier to understand and maintain. You can see all the resources and values in a single file. For advanced scenarios, linked templates enable you to break down the solution into targeted components.
3. You can easily add new resources in a new template and call them via main template.
Following are the resources that we deployed as a part of this blog post.
1. App service plan – To host the Webapp
2. App Service – Webapp to host the application.
3. Application insights – To enable monitoring.
Its hierarchy looks like this.
In general when we have a single file for deployments, we pass the variables in the same file or use a .tfvars file to pass the variables.
> Variables are same as Parameters in ARM templates
In the above file structure, each individual template for example: webapp.tf will have its variables that it needs. The values have to be passed to it when this module is called. Remember that each terraform file that we create is considered as a module.
Now lets see how the values are passed and modules are called in individual templates.

There are two main files that control the entire deployment.

1.  main.tf     -  Contains the code to call all the individual resources.
2.  main.tfvars -  Contains variables that are consumed by main.tf file

in the main.tf file, each of the modules will be called as follows:
The values for above variables will be passed from main.tfvars file.

We use the same templates for deployment to all the environments. so how does Azure DevOps handles deployments to different environments?

We keep place holders `#{placeholdername}#` for each of these values passed in our main.tfvars file.
when use the same templates for deploying to multiple environments, We use ‘replace tokens’ task in Azure DevOps and place respective values for each environment. This helps us in choosing different values for each environment.
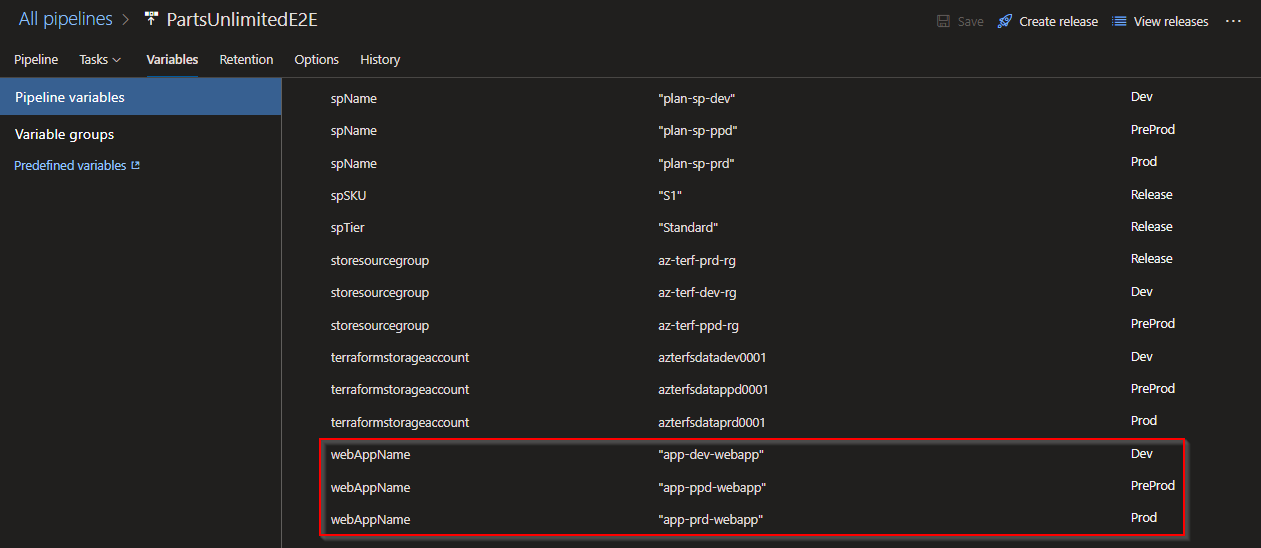
For example, the value for #{webAppName}# will be different per environment.
app-dev-webapp for dev app-ppd-webapp for preprod app-prd-webapp for prod
While the main.tfvars file has a place holder #{webAppName}# for this, we declare the values for it in our variables section of release pipeline
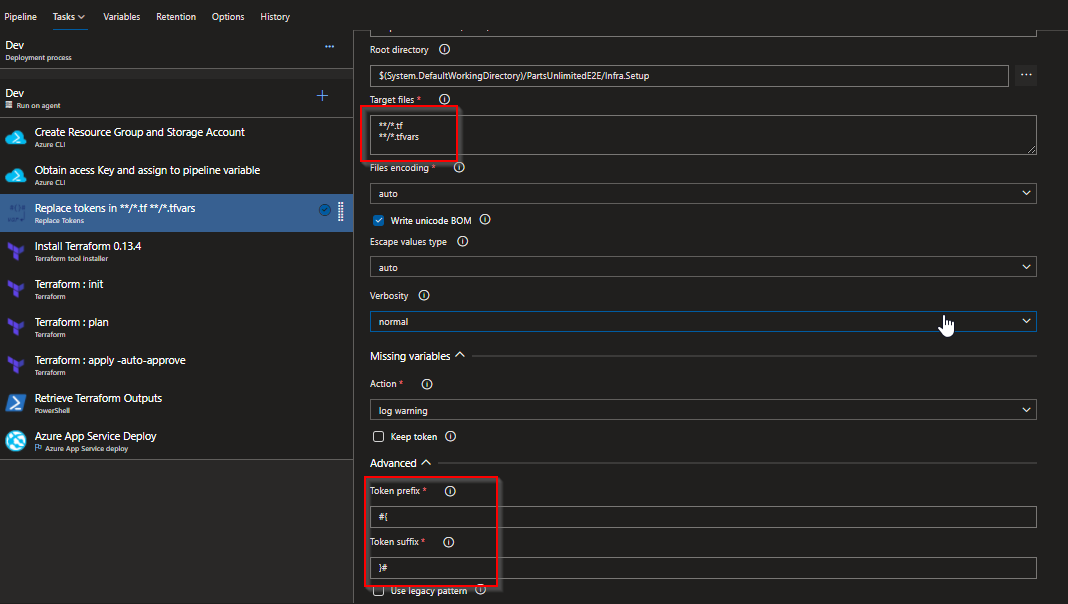
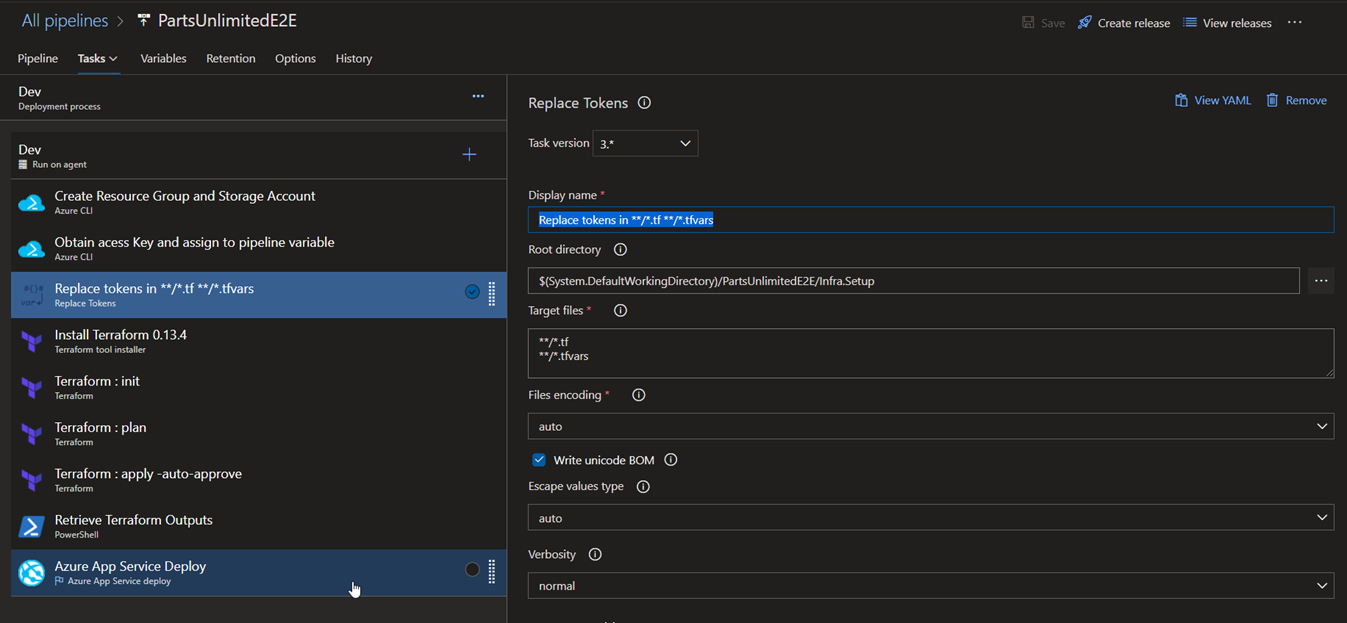
The ‘replace tokens’ task has an option called token prefix where we can declare the token prefix and suffix for the place holder value in the file we would like to replace in. In the target files, we place the files would like to get targeted for this replacement. Here we gave */.tf and */.tfvars as the target as these files have the placeholder content.
Build Pipeline
Build pipeline is mostly self explanatory as the first couple of tasks complie the application and publish the code.
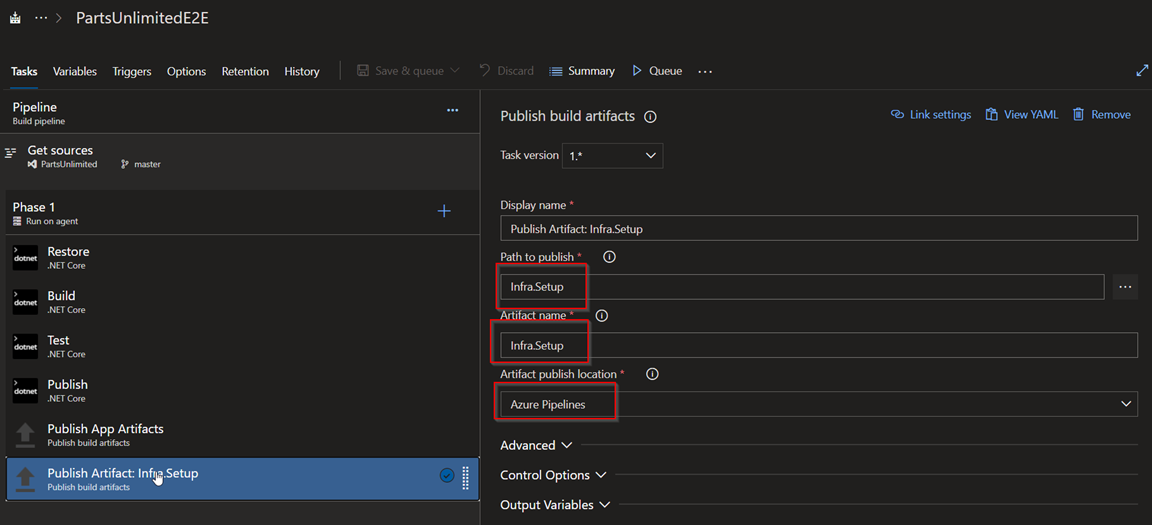
Take a look at the Publish Artifact: Artifacts, Publish Artifact: Infra.Setup tasks
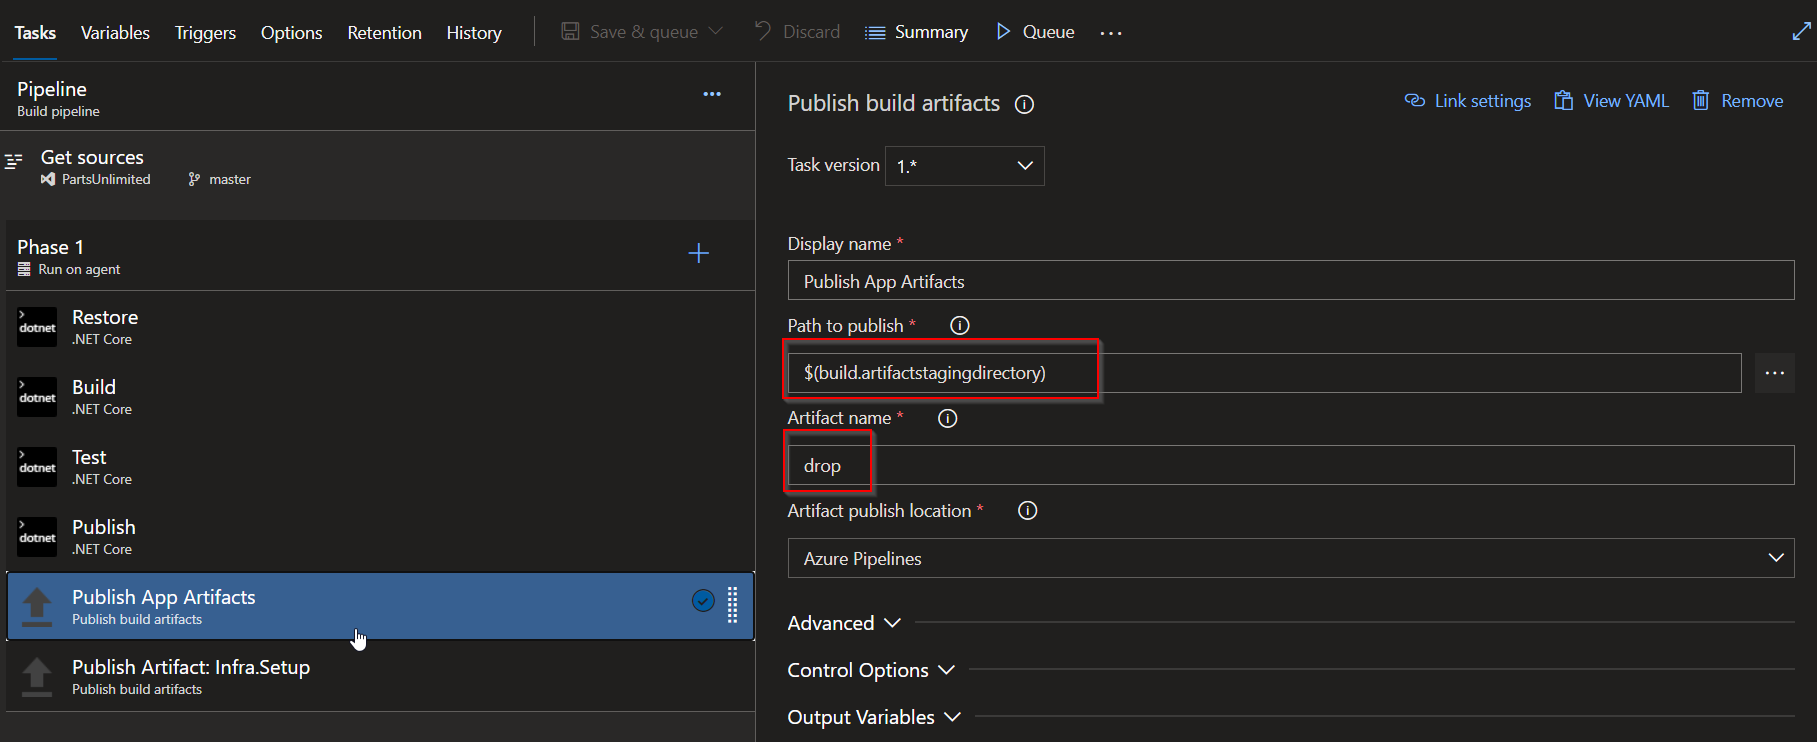
Publish Artifact: Artifacts : publishes the compiled code to Azure Pipelines for consumption by release pipelines
Publish Artifact: Infra.Setup tasks : publishes the terraform templates to Azure Pipelines for consumption by release pipelines. As we dont need to compile them we can directly choose them from the repo as path to publish.
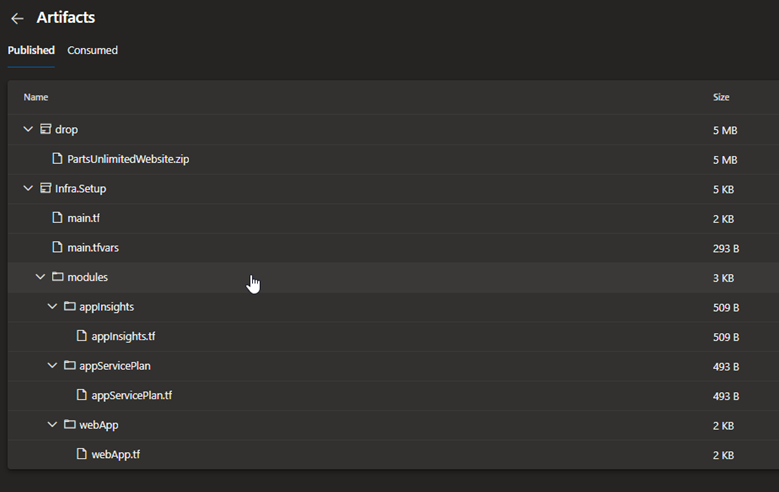
At the end of the build pipeline, it would publish the artifacts as below:
These will be consumed in our release pipeline for deployment.
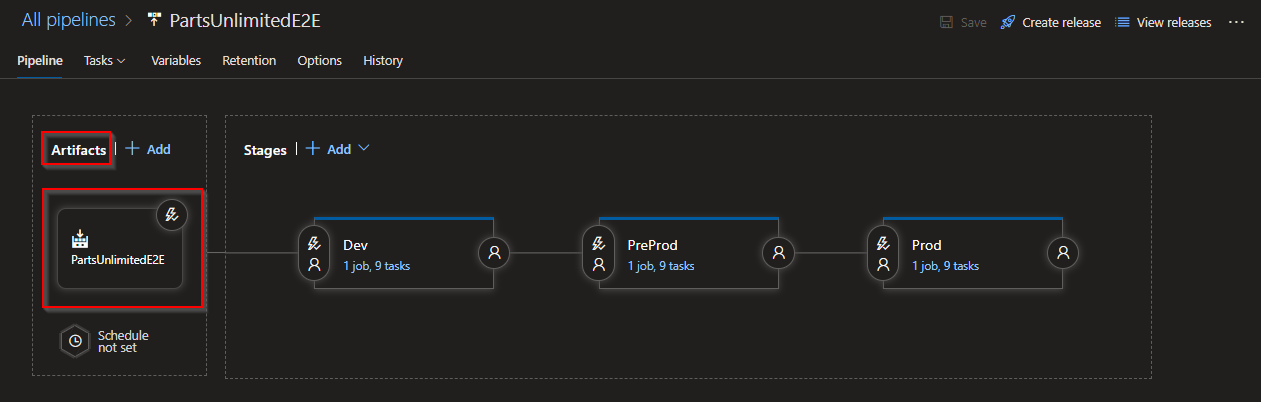
Release Pipeline
You can see that the source artifacts are from our build pipeline.
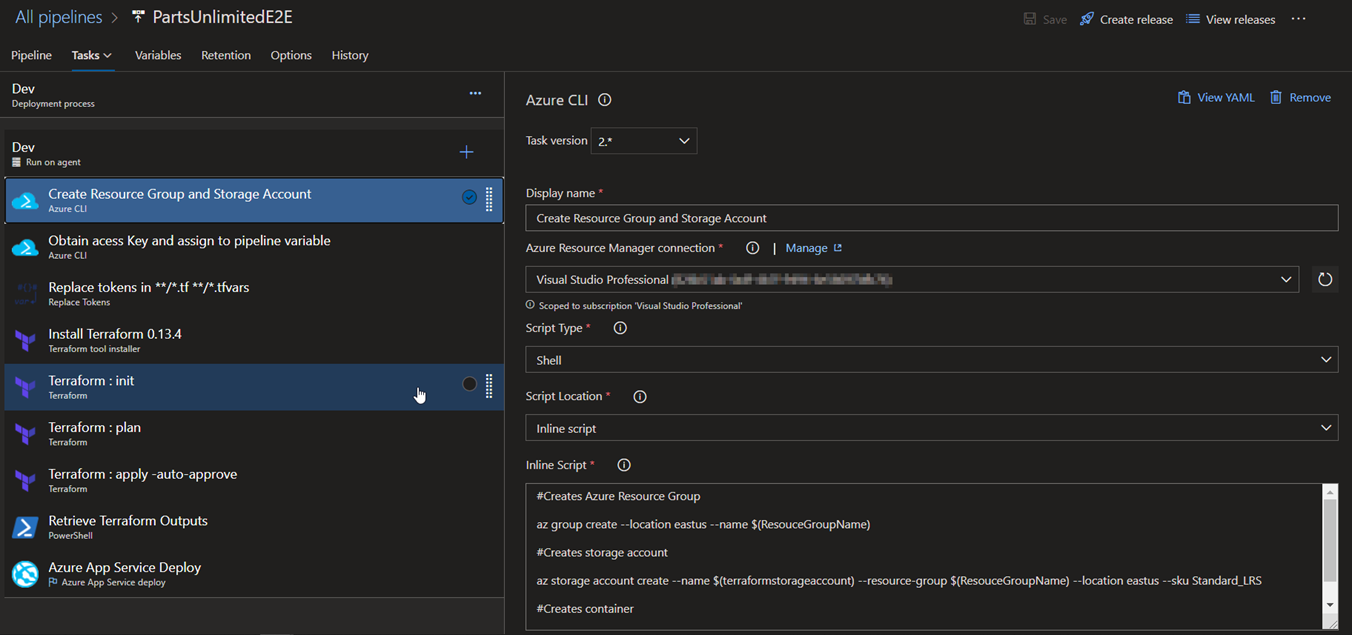
Now lets take a look at each of the release tasks.
1.Create Resource Group and Storage Account: Creates a storage account for storing .tfstate file that terraform stores the configuration of our deployment.
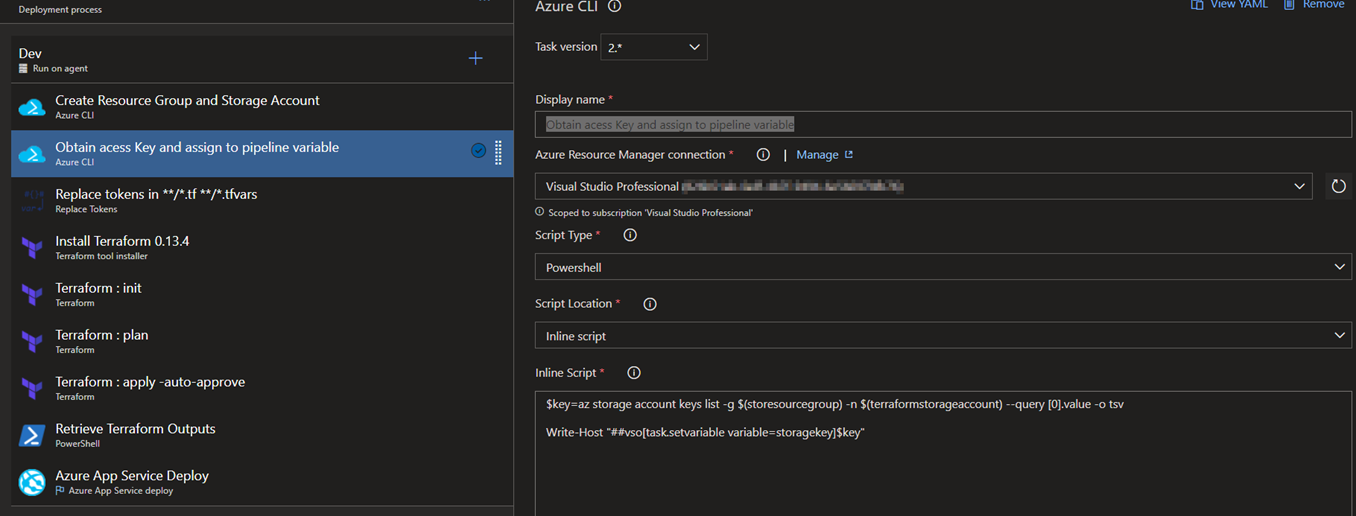
2.Obtain access Key and assign to pipeline variable: Retrieves the storage account key and assigns it to a variable in Azure Pipelines.
3.Replace tokens in */.tf */.tfvars:
Remember that we have kept place holders to replace the values per environment, this task is responsible for the same. Values for each of the place holders in main.tf file are in variables section of each stage.
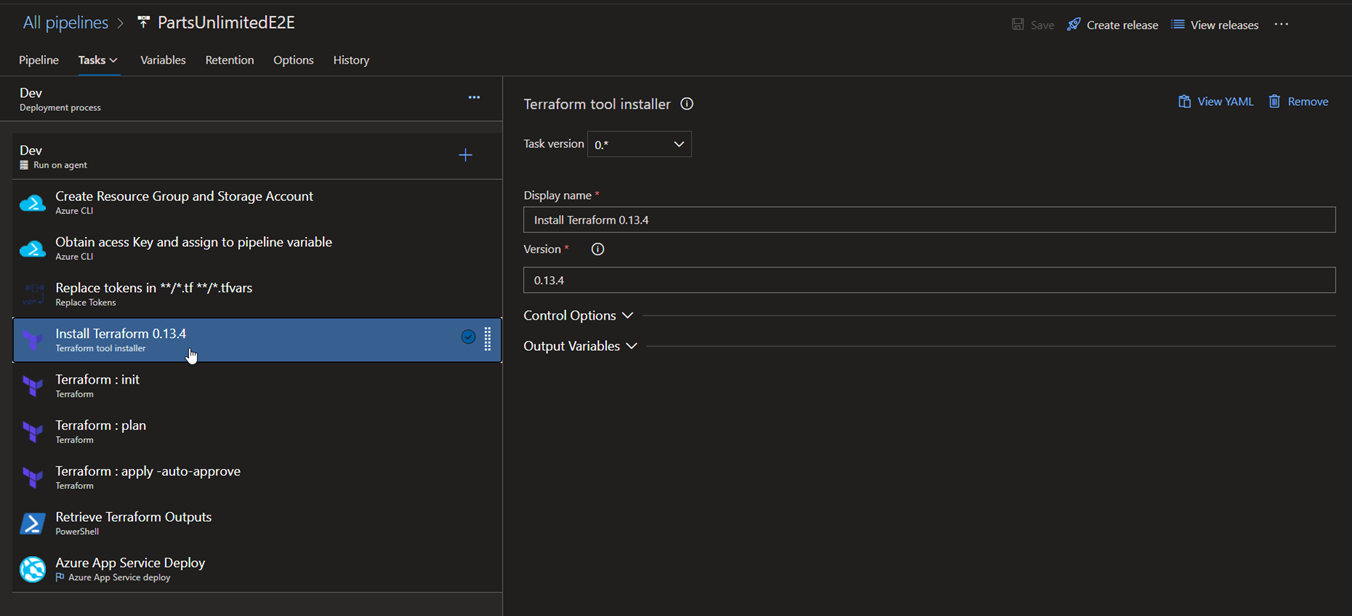
4.Install Terraform 0.13.4: Installs terraform on the release agent.
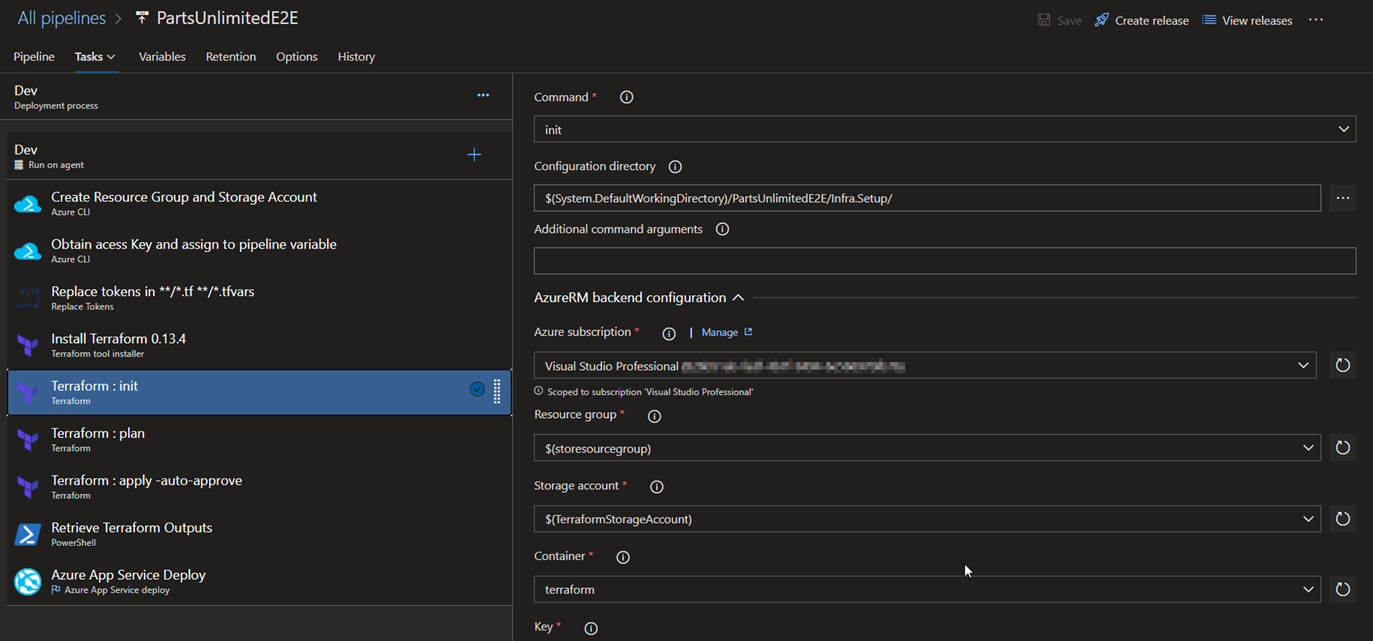
5.Terraform: init : Initializes the terraform configuration and we also have specified the storageaccount resource group and the storage account for it to place the .tfstate file
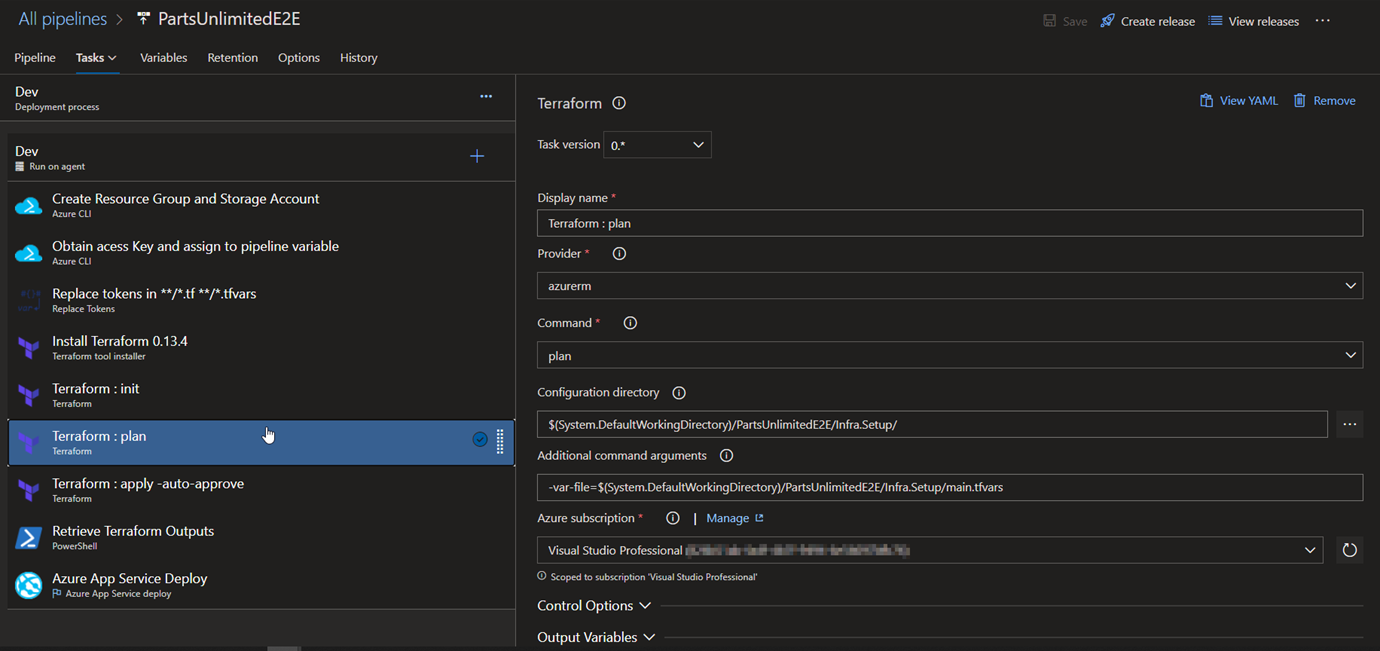
6.Terraform: plan : Runs terraform deployment in dry-run mode
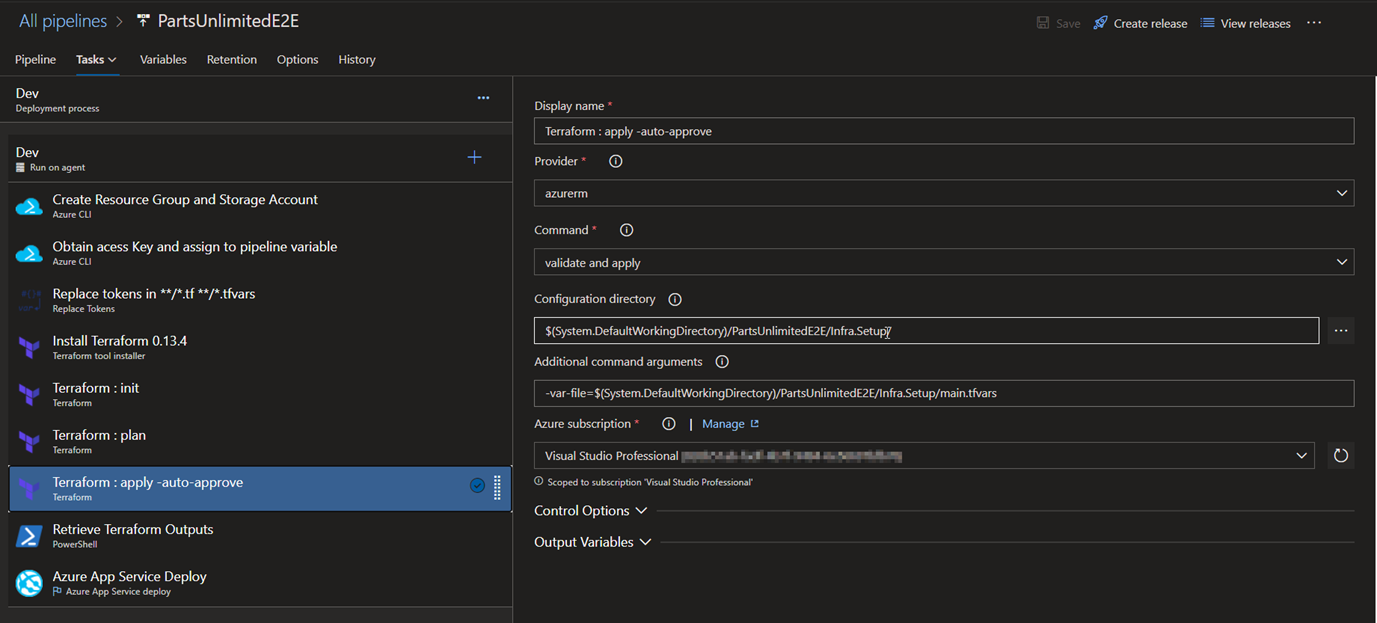
7.Terraform: apply -auto-approve: Applies the configuration based on the dry-run mode in step 6.
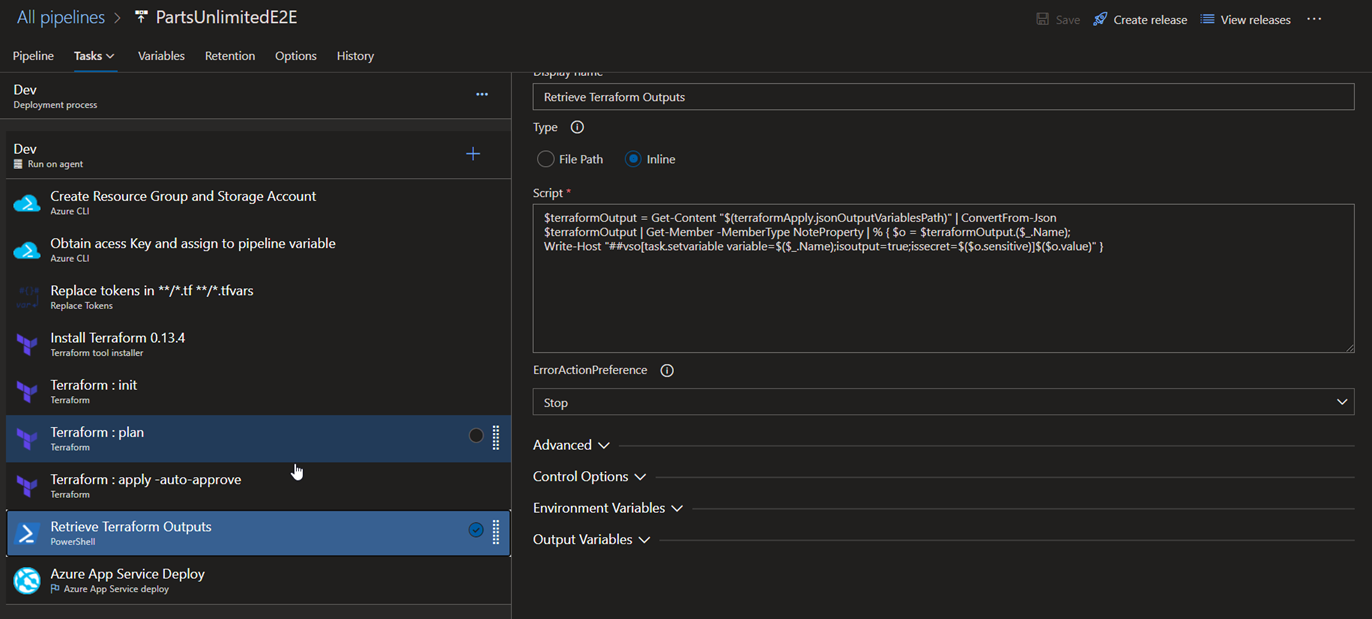
8.Retrieve Terraform Outputs: This task is mainly responsible for retrieving each of the outputs obtained after terraform apply is complete and they are being consumed by the ‘App Service Deploy’ task. In case of Azure, we have ARM Outputs task readily available for us, here we need to write a small script to get the outputs.
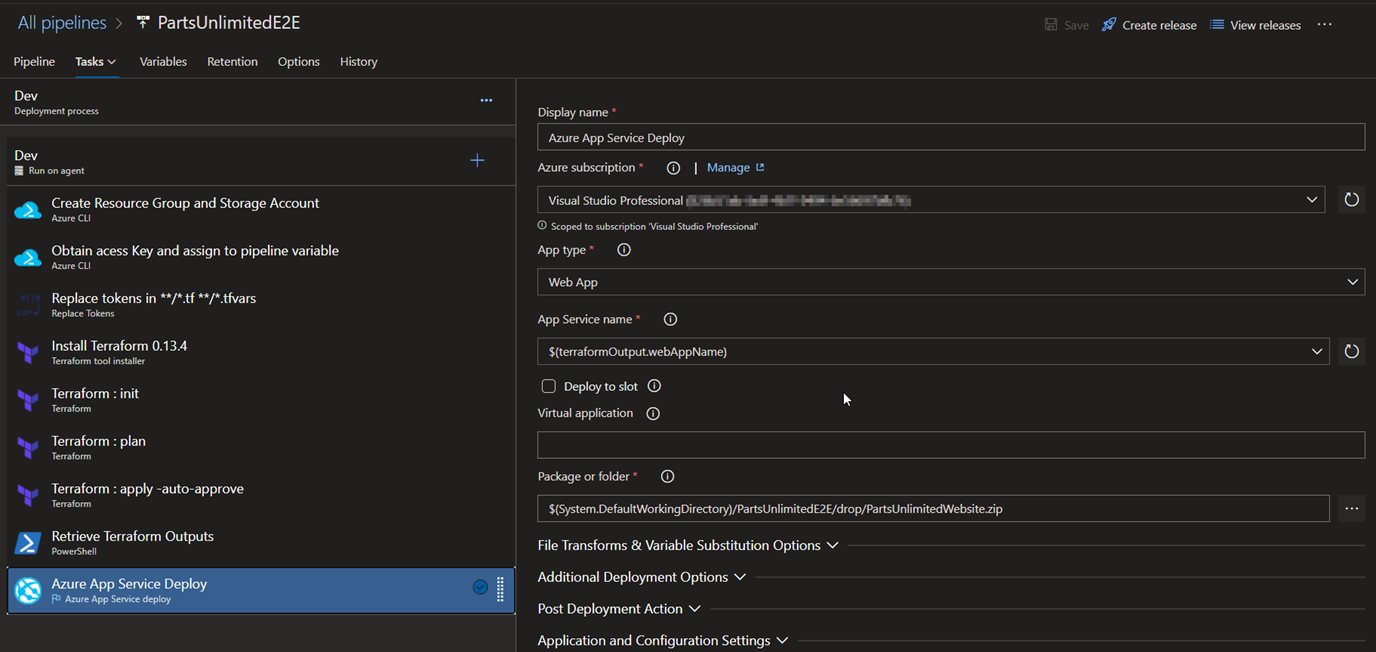
9.Azure App Service Deploy: Deploys the application code into the webapp.
Conclusion
This brings us to the end of the blog post.
Hope this helps you learn, practice and deploy your infrastructure using Terraform via Azure DevOps!!
Thanks for reading this blog post & Happy Learning..
When using a generic and decoupled integration design, your integrations span often multiple Logic Apps. For troubleshooting purposes, it’s important to be able to correlate these separate Logic Apps with each other. Recently, a new feature has been introduced to improve this.
Existing correlation functionality
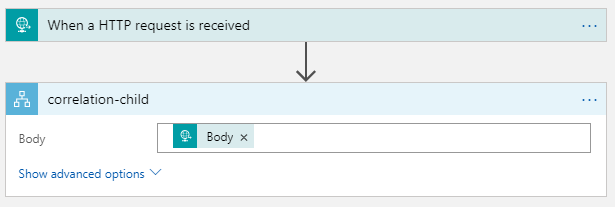
Let’s create a Logic App with a simple request trigger.
Invoke the Logic App. In the run history details, you will notice a correlation id.
Now, update the Logic App to call another Logic App.
Invoke the parent Logic App. In their run history details, you will notice that they both share the same id. This is because Logic Apps automatically adds the x-ms-client-tracking-id HTTP header, when calling the child Logic App. If this header is present, that’s the value taken for the correlation id.
Your client application can also provide this HTTP header, so a custom correlation id is used.
This blog contains some questions and answers about azure. It is a running document. It is being updated now and then with new questions. Hope you find it useful.
Question 1:
Why does a resource group need a location? And, if the resources can have different locations than the resource group, why does the resource group location matter at all?
Answer:
The resource group stores metadata about the resources. Therefore, when you specify a location for the resource group, you’re specifying where that metadata is stored. For compliance reasons, you may need to ensure that your data is stored in a particular region.
If the resource group’s region is temporarily unavailable, you can’t update resources in the resource group because the metadata is unavailable. The resources in other regions will still function as expected, but you can’t update them.
Question 2 :
What is the difference between azure service and azure resource ?
Answer:
In general there is no difference in azure service and azure resource. But you can say that azure service is the compute service provided over internet by azure and Azure resource is an instance of the service(Or its components.) When you pay for a service and use it for something it becomes a ‘resource’ for you.
You can also see the difference on the Azure portal when you click ‘Azure Services’ (It lists what they can provide) and ‘All Resources’ (It lists what you already have).
Question 3:
What is the difference between azure web jobs and timer triggered azure functions ?
Answer:
Webjobs are associated with app services. So if you have another web app deployed in the same app service, its performance will be affected by the web job. Web job is not an independent component.
Where as function apps are independent resources and easy to code and deploy than a web job. It will not impact any other services like web jobs might.
Question 4:
What happens to the workflow which is running, when you stop the logic app ?
Answer:
Stopping the logic app only disables the trigger, which means no workflow will be triggered even if the trigger conditions are met, if the logic app is stopped. However, the workflows which are already triggered, will complete their execution, even after the logic app is turned off.
How can you check the run history of a stateless workflow of a standard logic app ?
Answer:
You can see the run history of a stateless workflow in debug mode.
To enable the debus mode, you need to add the following key value pair in the config of logic app. Key : Workflows.<workflow_name>.OperationOptions Value : WithStatelessRunHistory
However, it will have some impact on the performance as compare to the stateless workflow running without debug mode, since it will have to make additional call to the storage account to write the state of the logic app as similar to the stateful workflow.
Stateless workflow supports managed connector actions but not support managed connector triggers. So you will have to use only built in triggers when you choose stateless workflow.
It is suitable only for short runs (max 5 min) for processing small chunk of data (under 64 KB), where you don’t have to store state, input and outputs. Which is why you can not resubmit a workflow run.
There are times where you would need to query data from multiple application insight whether from the same resource group or other resource groups. Below are the few use cases for this.
Use case 1:
Suppose you have an application which has multiple app services(or websites) and function apps in the same resource groups which are handling different tasks and receive huge number of requests.
So it is a good idea to create separate application insight for logging, tracking requests and monitoring these services based on your need. For example, You can club together the websites for one application insight where as you can have another application insight which will monitor the function apps. This way, your application insight will not be overloaded with data, which would make it complex to monitor or troubleshoot or query data, of individual resources.
When you use multiple application insights inside a resource group, there might be a need to collaborate the data of these app insight to get information about the application such as total number of failed request or total number of users or total number of errors and so on.
Use Case 2:
When you migrate one application from
on premise server to azure or
other cloud platform to azure or
one resource group in azure to another resource group
You would need your previous logs and custom events from the old application insight. There are use cases where the data collected from application insight are pushed into power bi reports which are critical to clients to keep track of their customers.
In such cases you have to query data from multiple application insight which are present in different resource groups.
Querying multiple App Insights:
Application insight analytics uses Kusto query language to retrieve data.
A Kusto query is a read-only request, to process data, and return results. The request is stated in plain text, using a data-flow model. The query uses schema entities similar to SQL’s: databases, tables, and columns.The query consists of a sequence of query statements, delimited by a semicolon (;) and flows through a set of data transformation operators that are bound together through the use of the pipe (|) delimiter.
You can query from multiple application insight analytics by using “union” option available in the Kusto query. You can use application insight name or app id (available in the API Access blade in app insight) in the query.
Syntax:
union table1, table2
This is very vague syntax. So I am providing you with some of the examples which will help you in forming your own query based on your need.
Example 1 :
If you want to query all the requests from both application insight:
union
app('ApplicationName1').Requests,
app('ApplicationName2').Requests
or
union
app('App ID of ApplicationName1').Requests,
app('App ID of ApplicationName2').Requests
Example 2 :
If you want to query all the Exceptionsfrom both application insight:
union
app('ApplicationName1').Exceptions,
app('ApplicationName2').Exceptions
or
union
app('App ID of ApplicationName1').Exceptions,
app('App ID of ApplicationName2').Exceptions
Example 3 :
If you have applied telemetry client in the code to log some custom events and want to query them from both application insight:
union
app('ApplicationName1').customEvents,
app('ApplicationName2').customEvents
or
union
app('App ID of ApplicationName1').customEvents,
app('App ID of ApplicationName2').customEvents
Example 4:
If you want to apply some data transformation or conditions:
union app('d8ebxxxe-xxxx-xxxx-xxxx-fxxxx854xxxx').customEvents,app('6abxxxx7-xxxx-xxxx-xxxx-bxxx5827xxxx').customEvents | where timestamp >= startofday(now(), -1) and timestamp < endofday(now(), -1) | order by timestamp asc
The above example collects data of custom events from both application insights and then applies the conditions on the collective result.
If you want to apply different conditions on each app insight you can do the same as follows.
union (app('d8ebxxxe-xxxx-xxxx-xxxx-fxxxx854xxxx').customEvents | where timestamp >= startofday(now(), -90) and timestamp < endofday(now(), -1) | order by timestamp asc),(app('6abxxxx7-xxxx-xxxx-xxxx-bxxx5827xxxx').customEvents | where timestamp >= startofday(now(), -30) and timestamp < endofday(now(), -1) | order by timestamp asc)
The above example is getting 90 days data from the first application insight and 30 days data from the second application insight.
You can customize the query as per you need, I have given few of the example just to let you know how you can use the union function in different scenario. Hope you will get benefit from it.
Note: This doesn’t work if the two application insights are in different tenants.